Gina Lucia

If you’re looking to understand, track, and improve your restaurant KPIs this year, this guide is for you.
👋 In this guide, we’ll show you 8 of the most important restaurant KPIs. 5 for your online restaurant operations and 3 for your in-house restaurant.
We’ll go through each in turn with calculations you can replicate to start tracking your restaurant’s key performance indicators today.
So, let’s get to it and begin by looking at the first 5 restaurant KPIs.
5 online restaurant key performance indicators
As a restaurant owner, you know first-hand how challenging it is to keep improving your service and continue having satisfied diners. When running your restaurant, you’re bound to run into challenges like a dip in total sales, cash flow, or lower profit margins.
Tracking specific restaurant KPIs can help you easily identify areas of improvement and focus on ways you can best use your budget, staff, and time.
In this section, we’ll start by discussing online restaurant key performance indicators (KPIs) for restaurants that offer delivery, pickup, or online ordering to their customers. But before we get to that, let’s first understand what a restaurant KPI is.

What is a KPI?
A key performance indicator (KPI) is a measurable value that you can use to track your restaurant’s performance and success over a given period. You can use KPIs to evaluate the important aspects of your restaurant’s performance, like sales and revenue, customer experience, food costs, etc.
KPIs can help you to see if your restaurant is succeeding in areas such as sales, acquiring customers and keeping them happy, retaining employees, and so on.
From measuring these metrics, you’ll get information on where your strengths and weaknesses are and make informed decisions on how to improve both.
Knowing that, let’s dive into the first restaurant KPI on our list – the food cost percentage.
Restaurant KPI #1: Food cost percentage
The food cost percentage (FCP) measures the cost of food ingredients used in a dish as a percentage of overall food sales. This restaurant KPI is extremely important because it reveals your restaurant’s profitability.
The benefits of monitoring your restaurant’s food cost percentage
Keeping tabs on your restaurant’s FCP is important because of the following reasons:
- It helps with setting appropriate food prices. Calculating the food cost percentage helps you determine the appropriate selling price for each dish. Typically, your selling price should be more than enough to cover the cost of goods sold (cogs) and labor costs. Altogether, these two costs make up your restaurant’s prime cost. Prime cost is extremely vital in determining the price of a food product.
- It is important for proper food inventory management. The key to running a profitable restaurant lies in proper inventory management. Calculating the FCP helps eliminate food waste, track unused ingredients, and maximize gross profit.
How to determine your food cost percentage
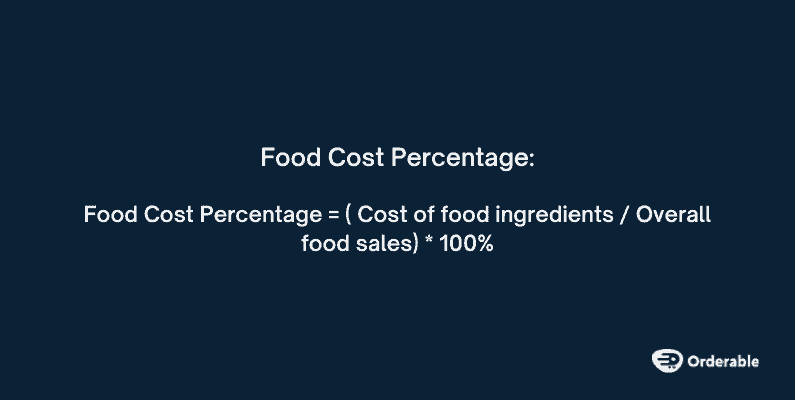
Calculating your FCP can be done with this simple formula:
Food Cost Percentage = ( Cost of food ingredients / Overall food sales) * 100%
Let’s say you have a salmon dish that sells on your menu for $15, and the cost of each ingredient is as follows:
- 1 salmon fillet: $2.30
- 10 oz mashed potatoes: $0.15
- 5 oz wilted spinach: $0.40
- 3 oz sauce: $0.30
- 10 oz quinoa: $0.30
The cost of our salmon dish ingredients per serving will be $2.30 + $0.15 + $0.40 + $0.30+ $0.30 = $3.45.
That means that the food cost percentage for this dish would be: 3.45 / 15 * 100 = 23%.
This restaurant KPI isn’t limited to specific dishes only. You can calculate your overall food cost percentages over a given period of time using the following values:
- Beginning inventory value – the dollar value of ingredients purchased at the start of a period.
- Purchases – the value of your additional inventory purchased during this period, and wasn’t part of your beginning inventory.
- Ending inventory – the value of the leftover inventory at the end of a period.
- Total food sales – the value of your sales for the period.
For this, our formula will be:
Food Cost Percentage = ( ((Beginning inventory + Purchase) – Ending inventory )/ Total food sales) * 100%
Note: There is no such thing as an ideal food cost percentage. This metric varies depending on the type of food you serve and your restaurant’s operating expenses. However, restaurant industry statistics suggest the food cost percentages should be between 28 and 35% of revenue if you want to run a successful restaurant.
Restaurant KPI #2: Customer retention rate (CRR)
Customer retention rate measures the percentage of customers that continuously dine with your restaurant over a specific period of time.
This restaurant KPI enables you to:
- Test and confirm your business’s ability to retain first-time or existing customers over time.
- Check if your customer retention and loyalty strategies are working well.
The period over which you can monitor the CRR varies. You can do it monthly, after a few months, or yearly.

What are the benefits of tracking your customer retention rate?
A higher CRR indicates that most of your customers return and make repeat purchases. Selling to regular customers is often easier than to new customers. They’re more profitable as a sizeable share of your total revenue comes from them.
Research shows that:
- Existing customers readily spend 31% more than new customers.
- Existing customers are 50% more likely to try new food products. This is because they’re impressed with your food offering.
Restaurants can also use it to determine whether their overall dining experience is good or not. If this value is high, customers are satisfied with your restaurant business.
Satisfied customers can leave positive online reviews and recommend your products on social media. This enhances your restaurant’s social proof, encouraging more new customers to dine with you.
How to calculate customer retention rate
To calculate your CRR, use this formula:
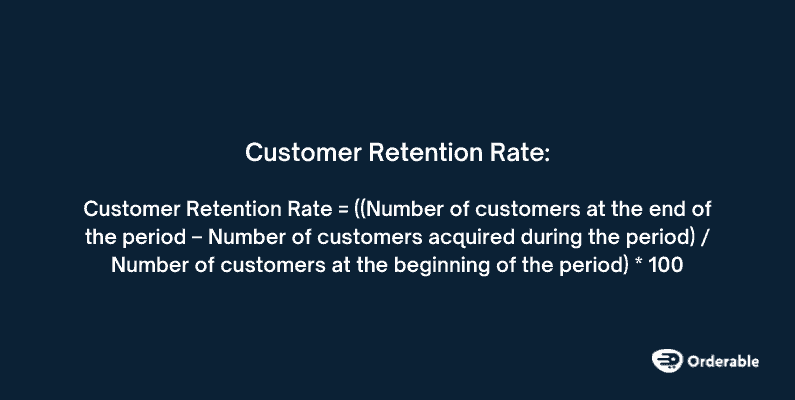
Customer retention rate = ((Number of customers at the end of the period – Number of customers acquired during the period) / Number of customers at the beginning of the period) * 100
- The number of customers at the end of a period is the total number of unique customers who made repeat orders during the specific period you are analyzing.
- The number of new customers acquired during this period refers to customers who made their first purchase during that time frame.
- The number of customers at the beginning of the period represents the total number of unique customers you had at the beginning of the period.
So, if you had 100 customers at the beginning of the month, acquired 30 new customers, and had 120 customers by the end.
Your customer retention rate would be: ((120 – 30) / 100) x 100 = 90%
This is a good CRR value. If it persists over an extended period of time, it indicates you’re doing a great job retaining your customers.
Restaurant KPI #3: Average order value (AOV)
If you’re looking to raise your gross profit value, growing your customer base is simply not enough.
To do this, you’ll want to increase your average order value (AOV). This restaurant KPI measures the average amount of money each customer spends per order at your restaurant.
Why should you monitor your customers’ AOV?
The AOV gives you an estimate of the amount of money your customer is willing to spend per order. As such, restaurants like yours can increase their profitability and total revenue by increasing their AOV.
You can increase the AOV through sales techniques like upselling, cross-selling, product bundling, tips, etc. For this reason, a high AOV indicates that these techniques are succeeding in getting your customers to spend more.
In contrast, if your AOV goes down, you’ll know you need to put more effort into these sales strategies to convince customers to spend more per order.
How to determine your AOV
AOV is a fairly simple metric to calculate. You need to find the total amount of money spent and the total number of orders fulfilled over a given period, say a month or year. Then, use this simple formula:
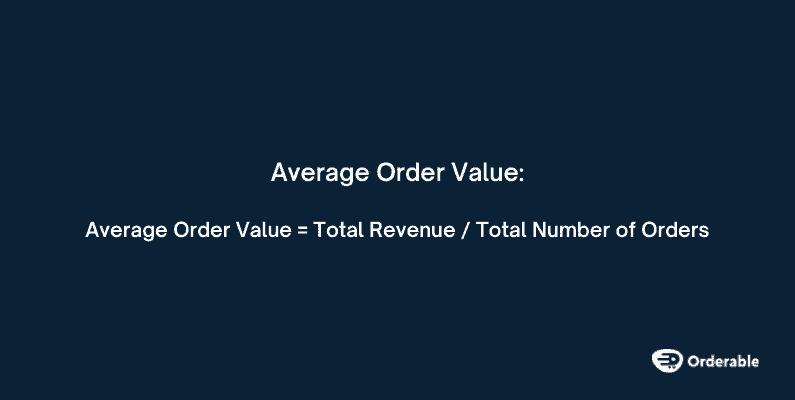
Average order value = Total Revenue / Total Number of Orders
NOTE: To get an accurate measurement, calculate your AOV over a long period of time, for instance, a year. Also, exclude unusually large or small orders from your calculation since they are a deviation from your typical orders.

Restaurant KPI #4: Customer lifetime value (CLV)
The customer lifetime value (CLV) metric calculates the revenue a restaurant can reasonably expect from customers throughout their entire relationship with your business.
Why knowing your customers’ lifetime value is important
Unlike AOV, which focuses on individual transactions, monitoring CLV helps you understand your customers’s long-term value and the overall health of your customer base.
This will encourage you to adopt a customer-centric business strategy. This involves focusing on customer satisfaction, loyalty, and retention strategies. Satisfied customers spend more on a business and remain loyal to it.
📈 According to a Hubspot study, 93% of customers will likely make a repeat purchase from a business when they’re satisfied with their experience.
In addition, since focusing on CLV involves improving customer retention, it enables your business to save on customer acquisition costs (CAC). This is because it costs 5 — 25 times more to acquire new customers than to retain current customers.
How to calculate your customer’s lifetime value
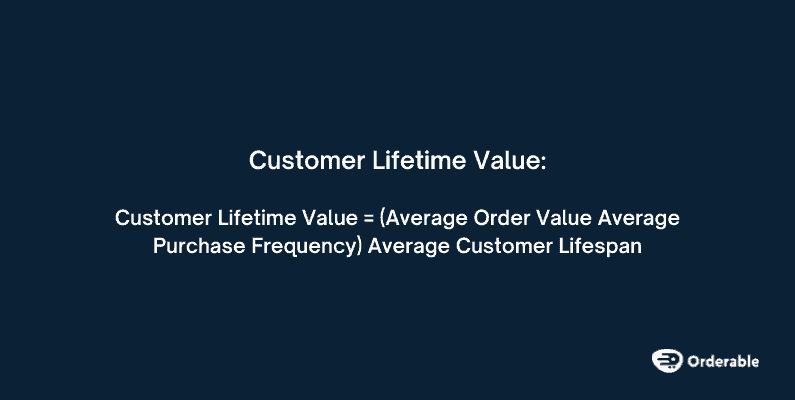
You can use this formula to calculate your CLV over a given period:
Customer lifetime value = (Average Order Value Average Purchase Frequency) Average Customer Lifespan
- Average order value: This is the average amount a customer spends during each transaction.
- Average purchase frequency: This is the total number of purchases divided by the number of unique customers who made purchases.
- Average customer lifespan: estimates the average number of years a customer is expected to continue ordering from your restaurant. It’s determined by adding up the customer lifespan of each customer and then dividing it by the total number of customers.
Suppose the average customer spends $20 per meal from your restaurant. On average, this customer orders from you four times a month.
If the average customer lifespan is 2 years (24 months), this will be your CLV:
CLV = $20 x 4 x 24
CLV = $1,920
In this example, the CLV for this customer is $1,920. This means that your restaurant will expect this customer to contribute $1,920 in revenue throughout their relationship with you, assuming their spending patterns persist.
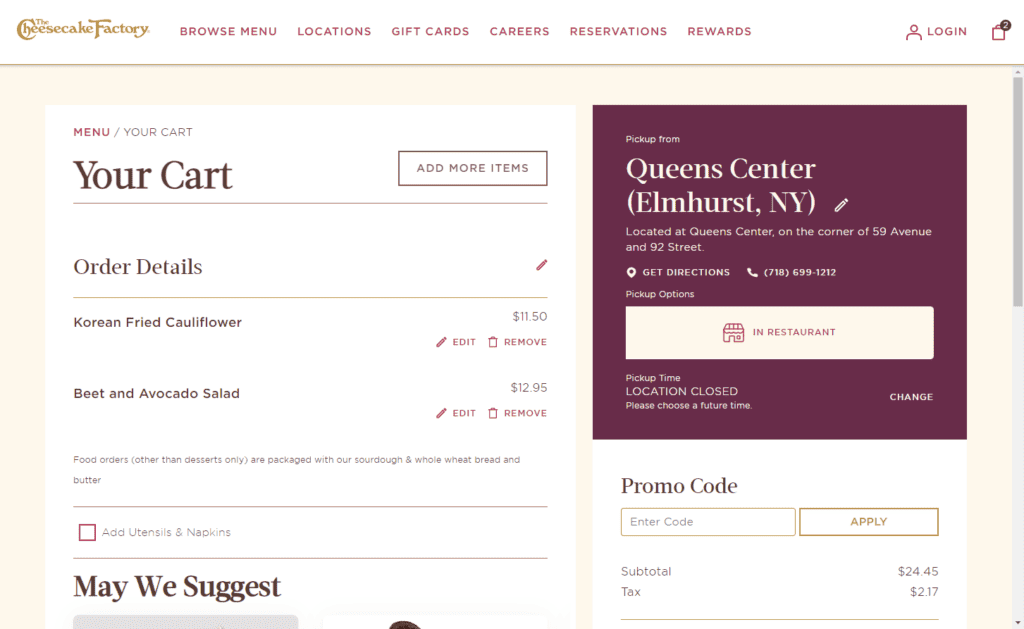
Restaurant KPI #5: Cart abandonment rate
The cart abandonment rate refers to the percentage of customers who add items to their shopping cart but exit before completing their purchase. It’s one of the metrics restaurants need to keep as low as possible if they want to be successful.
Improving restaurant KPIs like your CRR and CLV can reduce this cart abandonment rate significantly.
Why it’s important to monitor your cart abandonment rate
Regularly tracking your cart abandonment rate will help you identify reasons for cart abandonment.
Reasons such as unexpected shipping costs, a complicated checkout, account creation, etc., can result in a higher cart abandonment rate. Then, you implement strategies to correct these issues in your checkout process and reduce this restaurant KPI.
The lower this restaurant KPI, the higher the number of confirmed order purchases. This will boost your total online sales.
How to calculate your cart abandonment rate
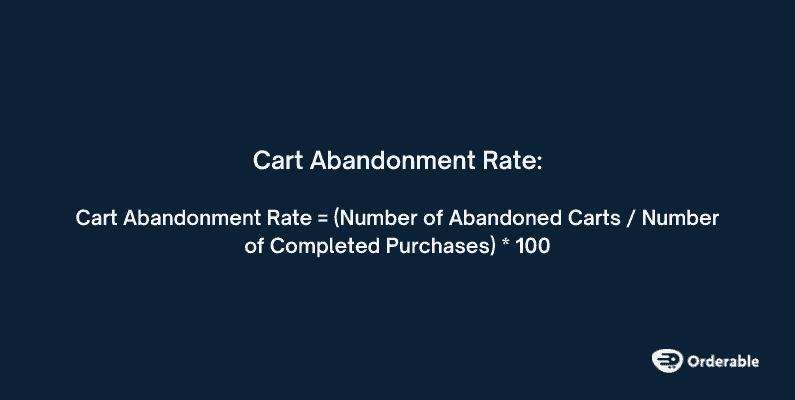
Here’s how you can calculate yours:
Cart abandonment rate = (Number of Abandoned Carts / Number of Completed Purchases) * 100
For example, let’s say your restaurant had 500 initiated carts, and only 300 of those resulted in completed purchases.
The cart abandonment rate would be: ((500 – 300) / 500) * 100 = 40%.
In this example, we’re doing great because the average online shopping cart abandonment rate is estimated to be 70%.
If you want to beat this statistic and reduce your cart abandonment rate, we’ve got the right WooCommerce plugin to help you do just that. Using Orderable also improves all the important restaurant KPIs your restaurant needs to track.
The online ordering system to help you get it done
Orderable is a robust online ordering system designed to help you manage your restaurant effortlessly and generate more profit.
This plugin integrates seamlessly with your WordPress website to enable you to process orders, accept online payments, generate receipts, and successfully deliver your orders – all online!
You can leverage Orderable’s key features to improve your restaurant’s KPIs in the following ways.
Get Your Restaurant Business Online With Orderable
Orderable is a user-friendly WordPress plugin that adds online ordering to your restaurant website.
Add your dishes, create your online ordering menu, customize your delivery schedule, and manage orders with ease.

Improve your AOV with Orderable’s sales-boosting features
Orderable enables you to increase the amount of money customers spend per order using these features:
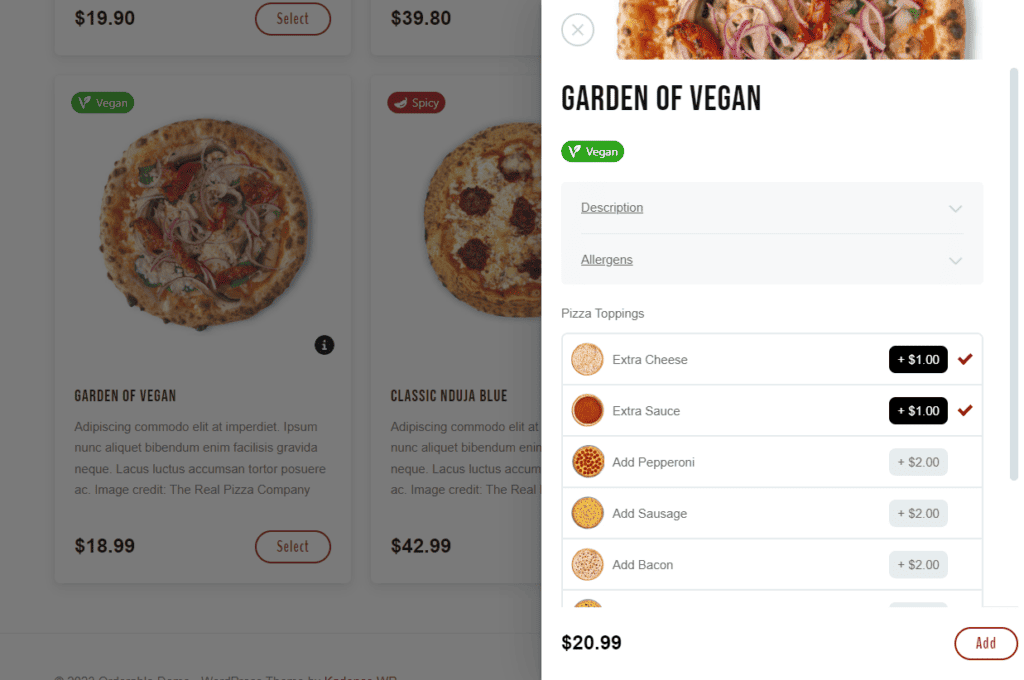
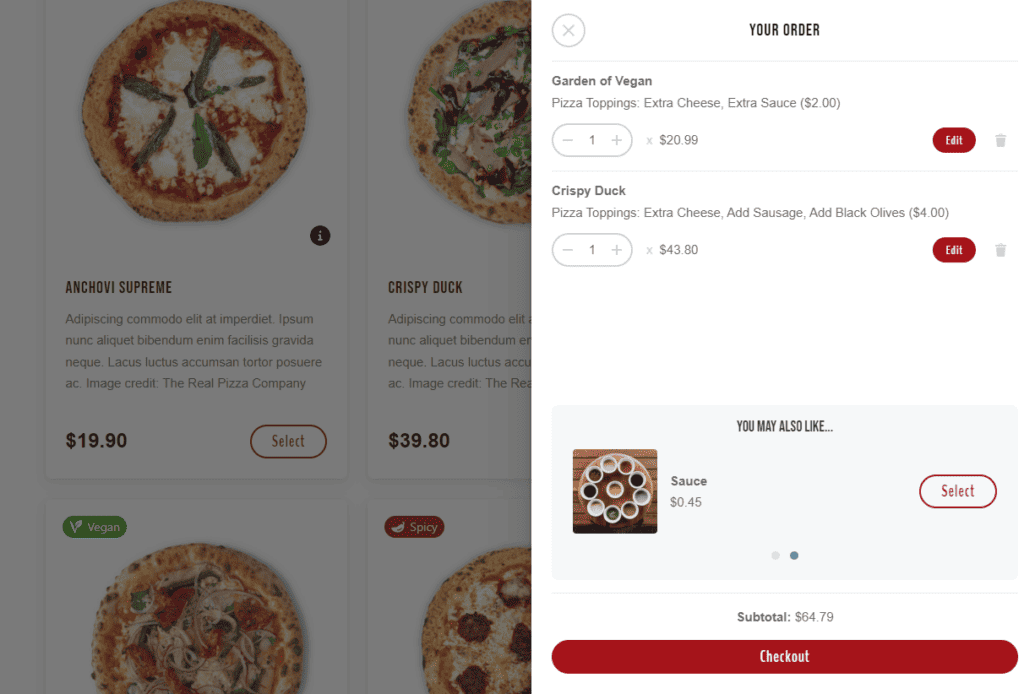
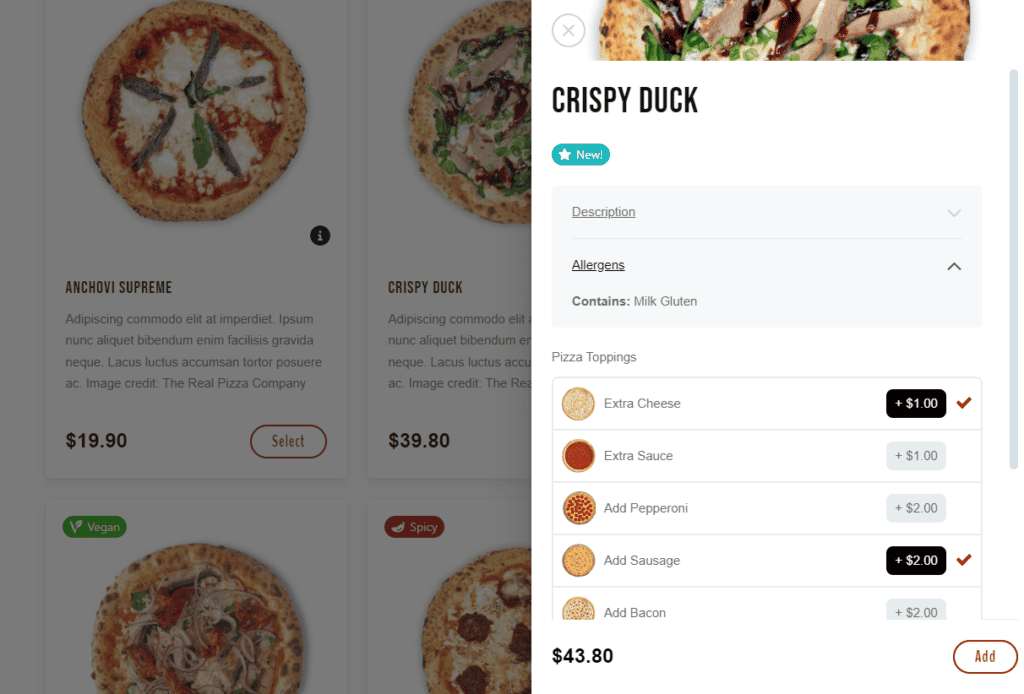
- Order bumps – You can suggest additional items, such as special sauces, sides, etc., that customers can add to their order to boost your AOV.
- Checkout tipping – With this plugin, you can add tipping to your checkout. Customers who are satisfied with your service will be happy to tip.
- Product add-ons/options – allow customers to add toppings, make a dish vegan, or add a side with product add-ons.
Orderable charges no additional fees for each transaction. You’ll keep all your revenue to yourself.
An efficient online ordering system to improve FCP
The online ordering system in Orderable enables you to optimize the food cost percentage in the following through:
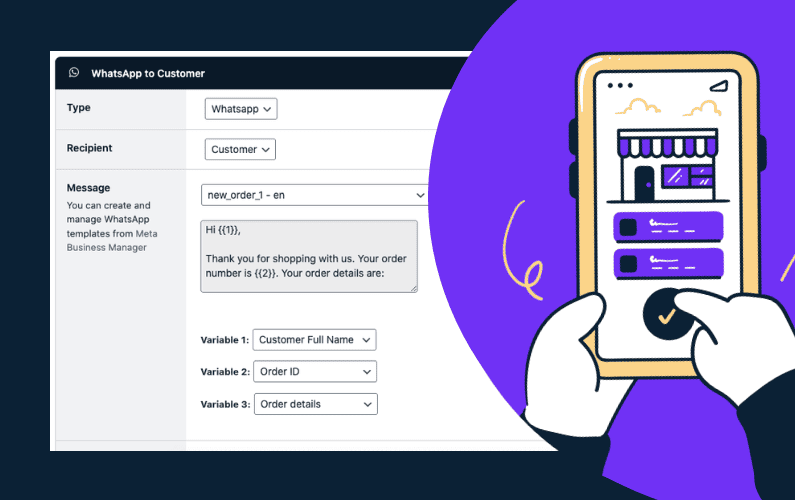
- An efficient order management system – Orderable, alongside WooCommerce, handles the entire process of taking an order, processing, and managing an order. All this is done in one central place. During this process, you can notify your customers of the order progress through WhatsApp, Twilio, and SMS. When an order is fulfilled, you can mark it as complete.
- Accurate food inventory management – this will help you track inventory in real-time. Preventing overstocking and food waste, which can reduce food costs.
- Dynamic pricing – Orderbale lets you adjust menu prices when you want or need to, and quickly. This technique can help you optimize your revenue while keeping food costs in check.
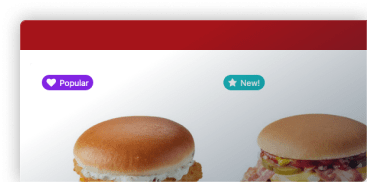
- Orderable lets you highlight popular, profitable food items with product labels.
- You can choose when your products or product categories are visible in your store. For example, show dishes that are perfect for lunch menus during lunchtime.
- You can manage orders between multiple restaurant locations, all on one website.
A seamless ordering experience for your customers
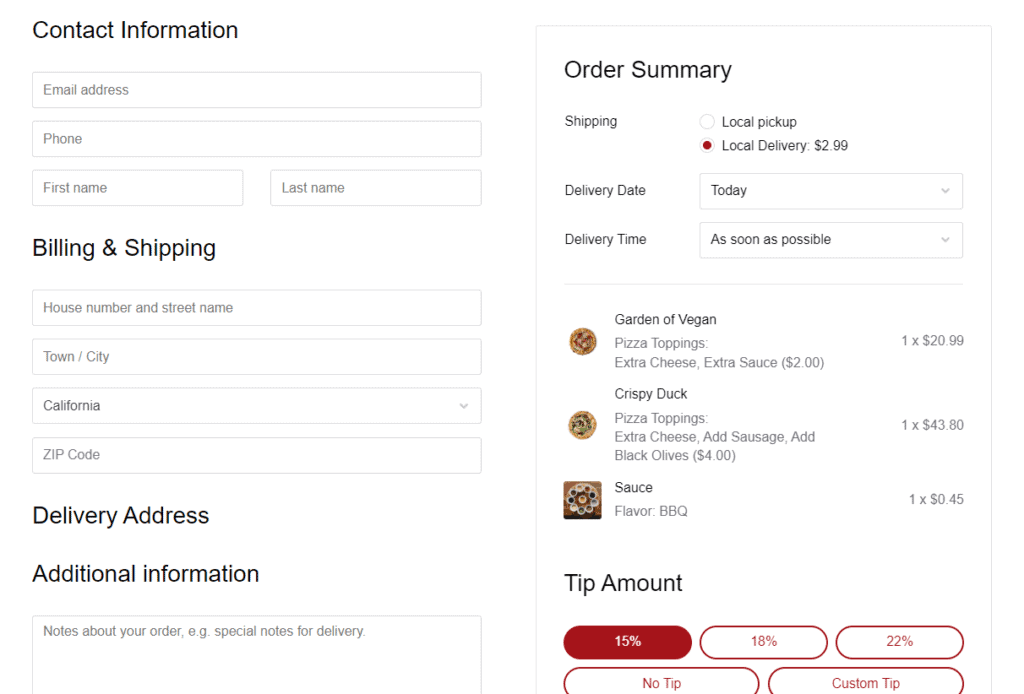
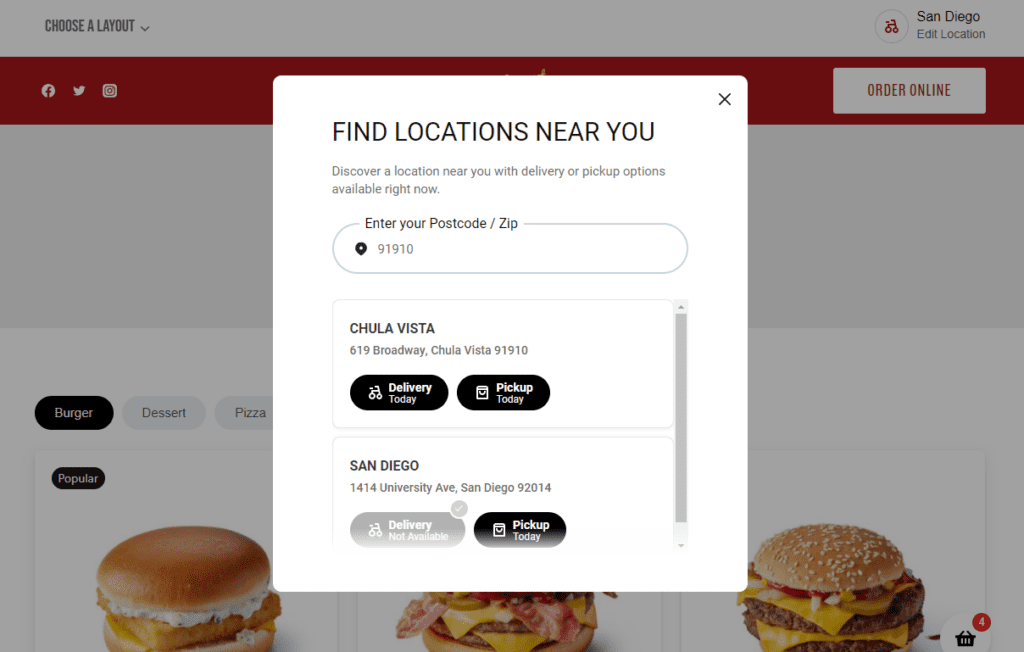
With Orderable, you can create a smooth ordering experience for your customers. First, Orderable looks great on all devices, thanks to its mobile-first design. Customers can order from their preferred devices, reducing the cart abandonment rate.
On top of that, it replaces the default WooCommerce checkout with a clean and modern one. This checkout page supports local pickup and delivery options with time slots. Customers can pick a date and time when it is most convenient for them to receive their orders. This adds to the overall experience, encouraging them to come back.
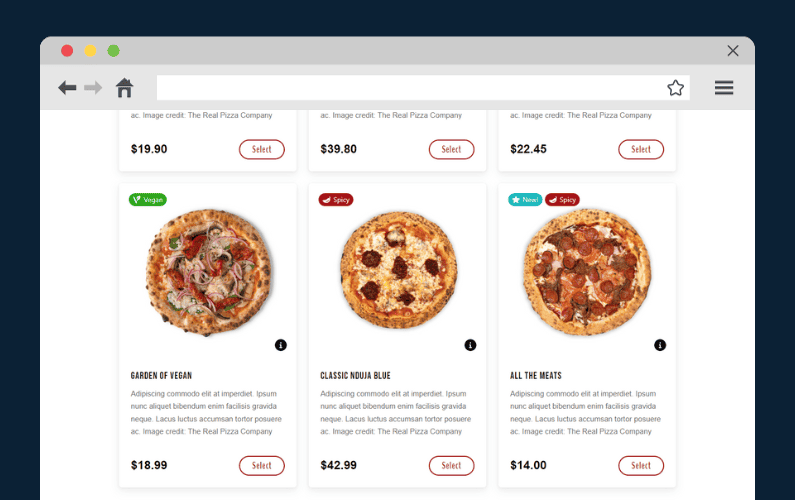
Flexible menu layouts that boost sales
Aside from all these, Orderable lets you create great-looking online menus that will cause your customers not to think twice. They’ll place their orders in an instant. This exclusive customer experience from start to finish in your restaurant will improve your CRR and CLV over time.
Now, let’s take a closer look at three in-house restaurant KPIs.
3 in-house restaurant key performance indicators
In this section, we’ll narrow down the three most important KPIs relevant to your restaurant’s internal operations. Top of the list is your employee turnover rate.

Restaurant KPI #1: Employee turnover rate
Employee turnover rate measures the rate at which employees leave a business.
📈 Studies show that this rate is barely inescapable, with the restaurant industry recording a high turnover rate of up to 150%, according to Hospitality Insights.
If restaurant managers leave this unchecked, it can hurt your efficiency, customer service, and overall morale. So, why is this restaurant KPI important?

Why employee turnover rate is important
A higher employee turnover rate may indicate issues with job satisfaction and employee retention. For instance, because of heavy workloads, they’re constantly burned out. It could be because of poor working conditions or other personal reasons.
A lower turnover rate, on the other hand, implies that your customer service is in better hands because there’s sufficient staff. They’re motivated and committed to their work.
How to calculate your employee turnover rate
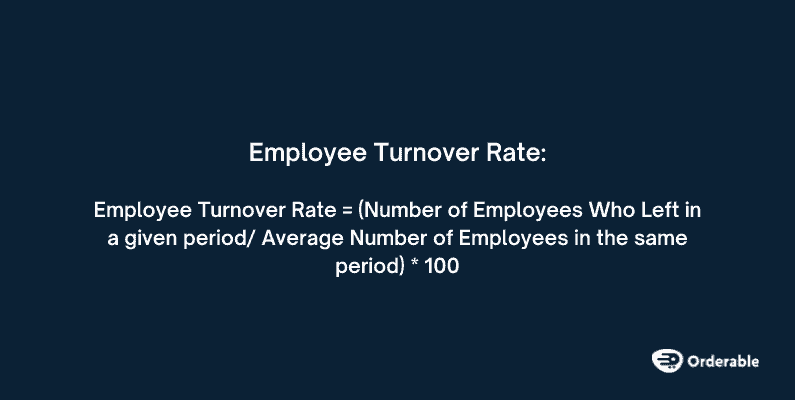
You can calculate your employee turnover rate using this formula:
Employee turnover rate = (Number of Employees Who Left in a given period/ Average Number of Employees in the same period) * 100
Here’s a breakdown of the formula:
- Number of employees who left: is the count of the employees who left the restaurant voluntarily or involuntarily during a given period.
- Average number of employees: This is calculated by adding the total number of employees at the beginning and end of the same period. Then, divide the sum by 2.
If you want to reduce your employee turn rate with minimal effort, you can do it with Orderable.
Strategies to reduce the turnover rate with the Orderable plugin
Orderable enables you to reduce your turnover rate in the following ways:
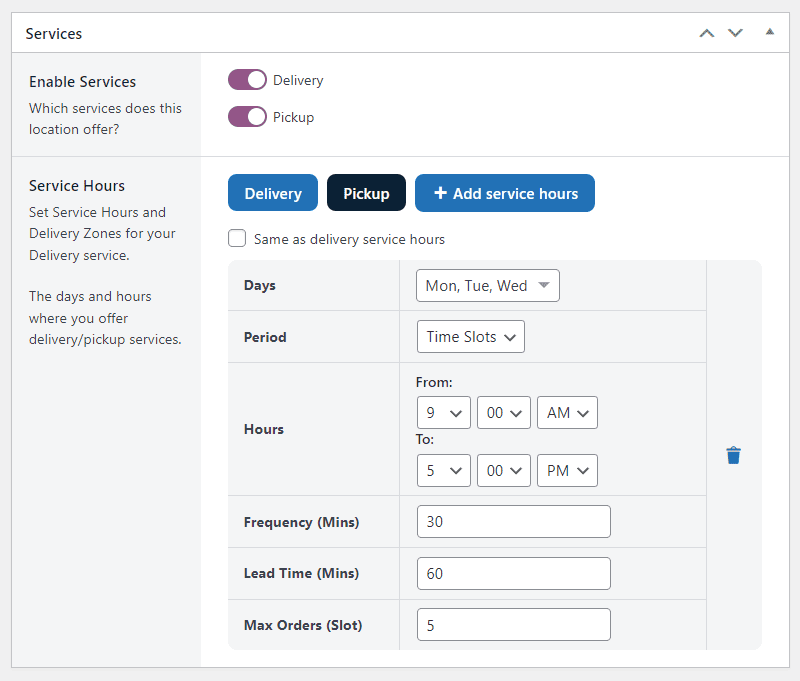
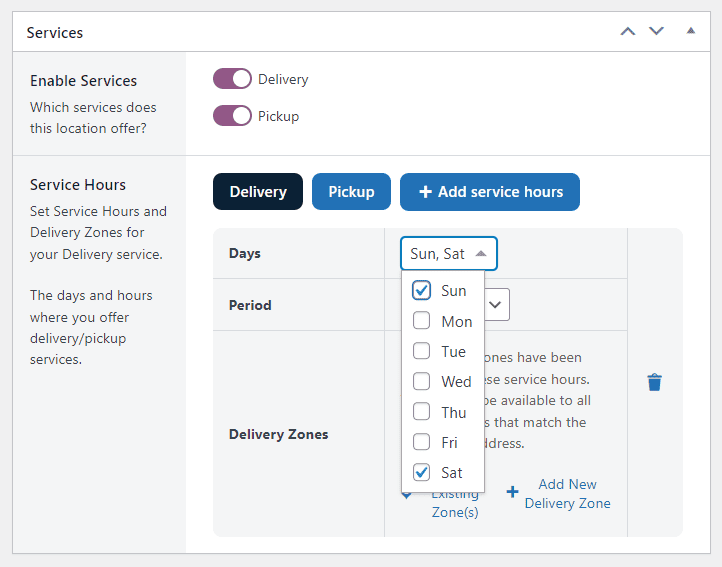
- Create customizable holiday scheduling – which lets you create one-off or recurring holiday schedules for your business. For example, you can create holidays during low seasons and give your employees a well-deserved break or a day off.
- Allocate time breaks when setting up time slots – this allows your employees to take a breather between orders. For instance, give them 30-minute breaks to blow off steam and avoid burnout.
- Efficient order management – Orderable allows contactless dining, which reduces the workload on your staff. They’ll only focus on food preparation, order processing, and customer service.

Restaurant KPI #2: Table turnover rate
The table turnover rate measures how quickly tables are cleared and reset to accommodate new customers. It is typically measured as the number of customers served at a table over a specific period of time, often an hour.
Why should you monitor the table turnover rate?
Restaurants aim for high table turnover rates to serve more customers throughout the day and increase revenue.
When your restaurant can efficiently serve many guests, your operations run smoothly. Both the front-of-house staff, responsible for customer service and seating, and the back-of-house staff, managing kitchen and food preparation, operate harmoniously.
How do you calculate your table turnover rate?
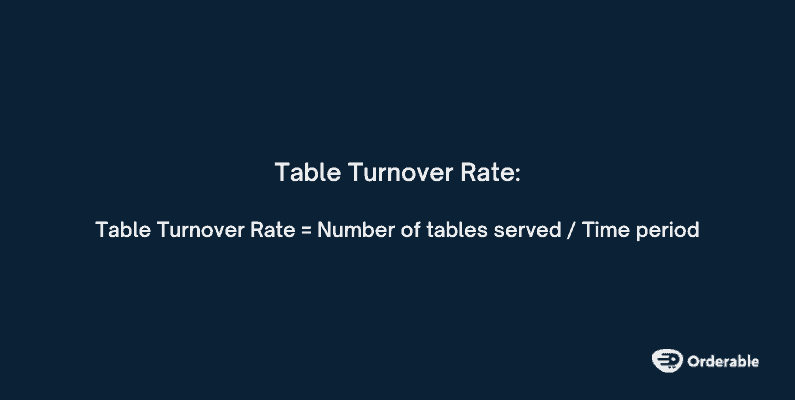
Here’s how you can calculate your table turnover rate:
Table turnover rate = Number of tables served / Time period
- Time period: this is the time period you chose and aligns with your operational needs. This can be per hour, per shift, per day, or any timeframe. The key is to select a time period that allows for accurate analysis and is consistent.
- Number of tables served: This can be calculated by counting the total number of guests or tables served during the time period you’ve selected.
For example, if you served 60 tables during a lunch shift that lasted for three hours, the table turnover rate would be 60 / 3 = 20 customers per hour.
Next, you’ll need to analyze and interpret this result. A good place to start is by comparing your rate with research industry benchmarks for turnover rates in similar types of restaurants.
The table turnover rate is closely related to the average table occupancy. So, let’s add average table occupancy to this list of in-house restaurant KPIs.
Orderable helps you streamline this process by eliminating tableside waiting.

How to improve your table turnover rate with Orderable
You can improve the table turnover rate by implementing contactless QR code ordering and payment with Orderable’s table ordering feature.
This feature allows you to assign QR codes on all restaurant tables. This eliminates tableside ordering because when customers arrive, they can scan their table QR code, view your menu, place an order, and pay using their phones.
The kitchen will receive a notification, prepare the meal, and deliver it to a customer’s table quickly.
Get Your Restaurant Business Online With Orderable
Orderable is a user-friendly WordPress plugin that adds online ordering to your restaurant website.
Add your dishes, create your online ordering menu, customize your delivery schedule, and manage orders with ease.
Restaurant KPI #3: Average table occupancy
The average table occupancy is the percentage of time customers occupy a restaurant’s tables. It is a measure of how efficiently a restaurant is utilizing its available seating capacity.
Increasing your restaurant’s table turnover will create more tables for new customers to occupy.
Why it’s important to know your average table occupancy
A restaurant with high table occupancy always has most of its tables filled with customers.
Closely monitoring this restaurant KPI will help you identify peak hours and assign more staff to handle the high demand. Doing this will improve service efficiency. A few staff can effectively serve customers during off-peak hours while others get rest. At this time, only a few tables are occupied.
If your average table occupancy is always higher, it also signifies that your restaurant is popular and in high demand.
How to determine the average table occupancy
Here’s an outline of how you can calculate your average table occupancy:
Average table occupancy = (Number of Tables Occupied / Total Number of Tables) * 100
Number of tables occupied: this is the count of the number of tables occupied by customers during a selected timeframe. For example, an hour, a day, or a month.
Total number of tables: is the total number of tables available in your restaurant.
Track the most important restaurant KPIs today
To stay successful and grow your business, you need to monitor your restaurant KPIs continuously. Keeping a close eye on these restaurant KPIs will help you identify opportunities for optimizing your digital operations, create memorable dining experiences for your customers, and maximize your profits.
Orderable simplifies this process by providing an efficient online ordering system. This ordering system will enhance your restaurant’s digital operations, offer the best customer experiences, and boost your sales.
Try Orderable today to make your restaurant operations seamless and excel across all metrics.
Get Your Restaurant Business Online With Orderable
Orderable is a user-friendly WordPress plugin that adds online ordering to your restaurant website.
Add your dishes, create your online ordering menu, customize your delivery schedule, and manage orders with ease.
Gina Lucia is our in-house Content Manager at Orderable. She writes articles, user guides, technical documentation, and creates videos on everything WooCommerce and Orderable.
Gina has been working in the WordPress/WooCommerce space since 2012 when she developed WordPress websites for clients large and small.
For the past 8 years, she’s been writing about everything WordPress and WooCommerce, becoming an expert in what makes a WooCommerce store succeed.
When not writing, Gina loves to tend to her vegetable garden, read, or travel to mainland Europe.
Don’t miss out on the latest Orderable news!
Sign up for our newsletter to receive the latest news from the blog, you’ll get pinged every week with a digest of the latest updates.
[fluentform id=”6″]

Related Articles

Town Hall: Orderable Multi-Location
How to Easily Add a WooCommerce WhatsApp Order Notification to WordPress

How to Handle Restaurant Complaints in 2026
Get Your Restaurant Online With Orderable
The WooCommerce plugin designed to help restaurants take orders online – with no added fees!
View Pricing